Super-Resolution Optical Microscopy
Ben Morrison, Yang Xu
Although the resolution of a light microscope is fundamentally limited by diffraction to about half of the wavelength of light, in recent years several techniques have been developed that can overcome this limitation in fluorescence microscopy. We are aiming to implement several of these techniques and apply them to biological samples and polymers.
Structured Illumination Microscopy (SIM)
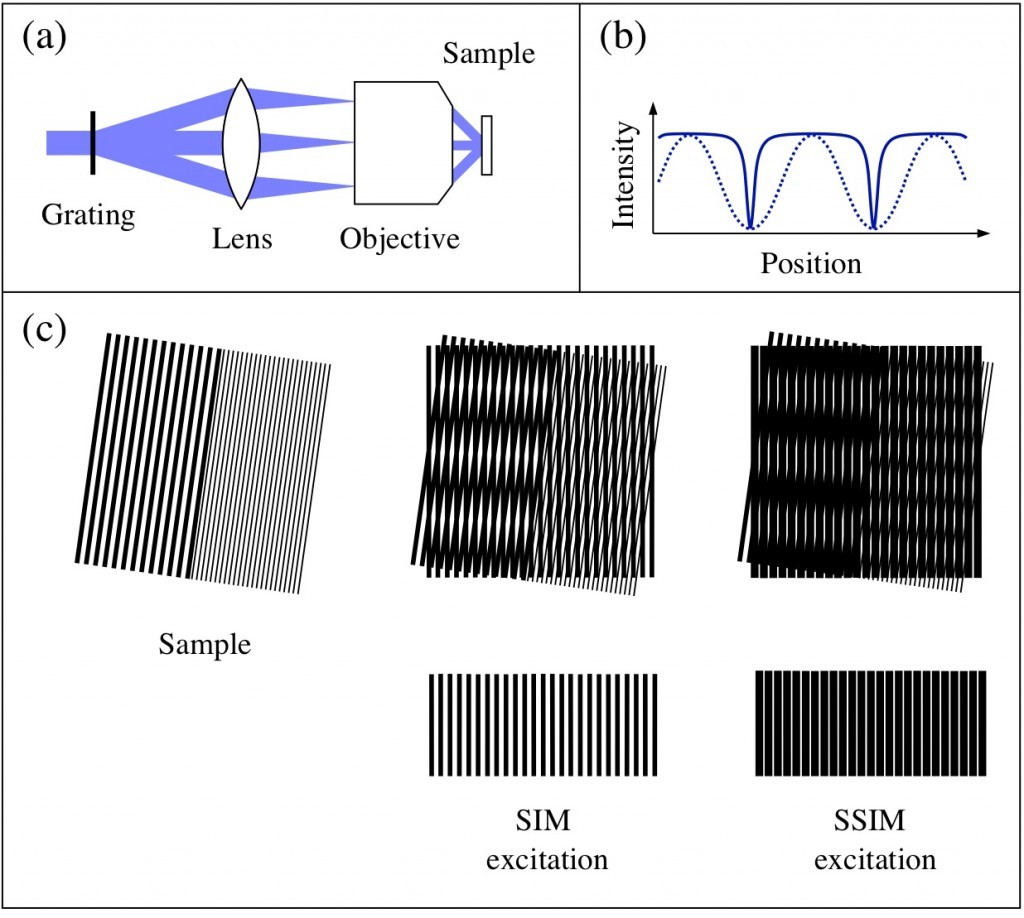
Structured illumination microscopy is based on the projection of a fine grating structure onto the sample. When the high-frequency sample structure is multiplied with a high-frequency grating pattern, low-frequency information appears in the form of Moiré fringes. These fringes transfer otherwise unobservable high-frequency information about the sample into a lower-frequency region that is observable through a microscope. The final image is reconstructed from a series of images where the pattern is moved and rotated between the images, typically from a total of 9-15 images. No unusual properties are required from the sample or the fluorophore compared to conventional fluorescence microscopy. The resolution improvement is limited to a factor of two, but we are hoping to extend this technique to saturated structured illumination microscopy (SSIM) using photoswitchable fluorophores, where the resolution is limited only by the signal-to-noise ratio.
Figure 1: Structured illumination microscopy. (a) A grating in the beam path diffracts the excitation beam, and the diffracted beams are focused to the back focal plane of the objective. The beams interfere in the sample and create a sinusoidal pattern (b, dashed line). When the illumination intensity is no longer linearly dependent on the excitation intensity, the effective excitation pattern is no longer sinusoidal (b, solid line). (c) Moiré fringes: when two high-frequency patterns are multiplied, Moiré fringes appear. While SIM is capable of resolving structures half the size of the diffraction-limited resolution, SSIM allows features much smaller than this to be resolved.
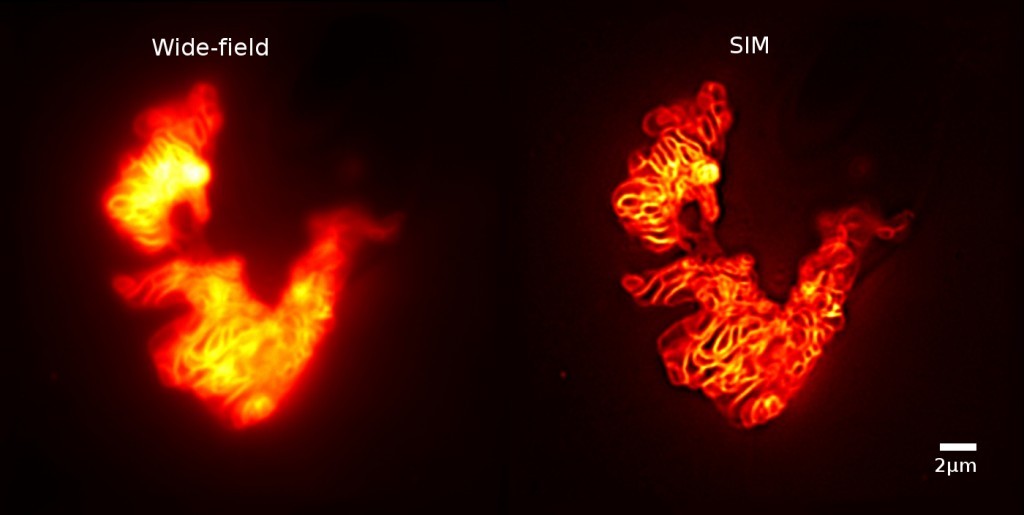
Figure 2: GFP-stained mitochondria in COS-7 cells imaged with conventional wide-field and structured illumination microscopy. (Sample from Laura Osellame and Mike Ryan, La Trobe University.)
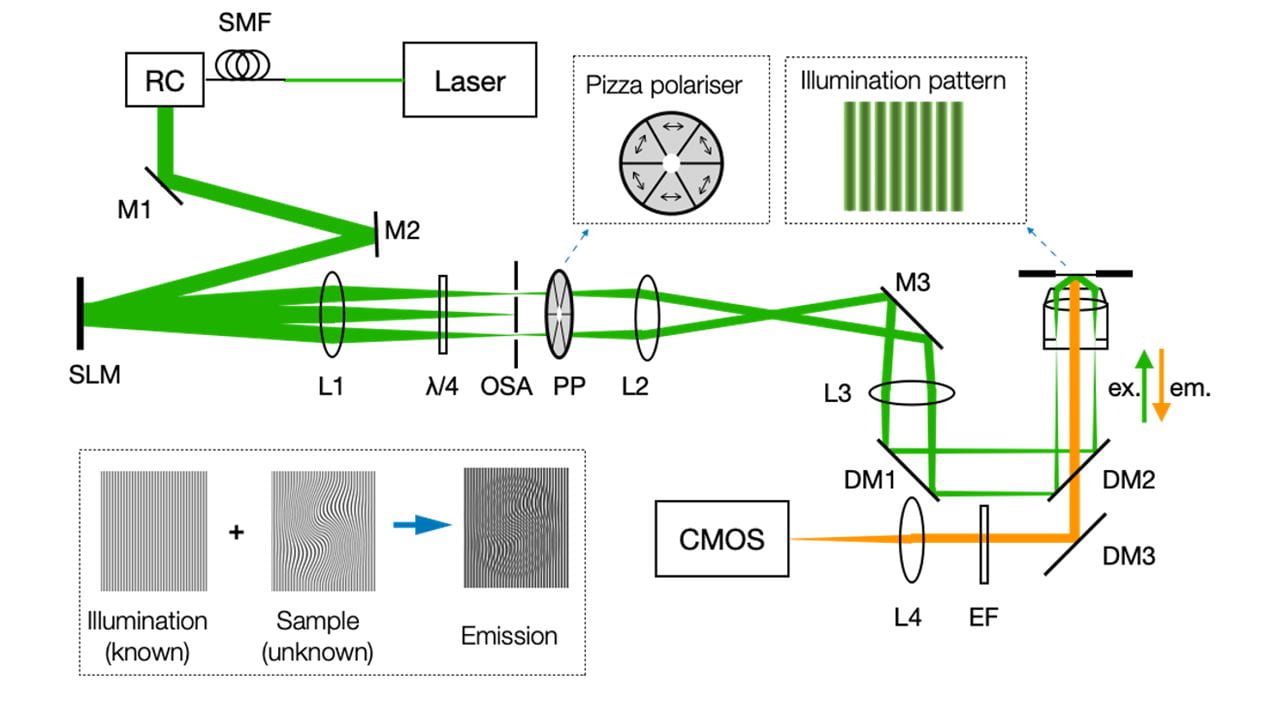
 Figure 3. Diagram of SIM setup. M: Mirror; SMF: Single mode fibre; RC: Reflective collimator; L: lens; OSA: Order selection aperture; PP: Pizza polarise; DM: Dichroic mirror; λ/4: Quarter wave plate; EF: Emission filter.
Stimulated Emission Depletion Microscopy (STED)
Stimulated emission depletion (STED) microscopy is a super-resolution technique that overcomes Abbe’s diffraction limit by sharpening the Point Spread Function (PSF). In STED, two laser beams with different wavelengths are overlapped and arrive at the sample with a defined time delay. The shorter wavelength beam excites the sample, while the longer wavelength beam is carefully selected to deplete the sample emission with a doughnut-shaped beam profile. In the region where the two beams are overlapped, the STED beam depletes electrons from the excited state through stimulated emission at the stimulation wavelength (see in Figure 4(a)). In centre of the beam profile (the centre of the doughnut), stimulated emission is minimal, therefore spontaneous emission (i.e. fluorescence) is allowed to occur. The size of the region where spontaneous emission takes place is smaller than the diffraction limited spot size of the excitation beam, providing an enhancement of the spatial resolution of the imaging system.
 Figure 4. (a) A simple diagram of stimulated emission. (b) Working principle of smaller PSF in STED microscopy.
Figure 5. Diagram of STED setup. P: Prism; SMF: Single mode fibre; PM: Phase mask; DM: Dichroic mirror; BS: Beam splitter; λ/4: Quarter wave plate; LPF: Long-pass filter; SPF: Short-pass filter; PCM: Photon counting module.
In our STED system, the excitation and depletion beams are selected from a white light continuum generated by a fibre supercontinuum laser. The spectrum of the two beams is selected by passing the laser beam through a prism, with the diffracted light directed into two slit-based wavelength selectors. By manually changing the position and the width of slits, the centre wavelength and bandwidth of the selected beam can be selected. The two beams are back-reflected and recombined by the same prism, spectrally selected with DCMs, then coupled into optical fibres and directed into the STED microscope (Figure 5).
Relevant papers:
- L.M. Hirvonen & T.A. Smith, “Imaging on the Nanoscale: Super-Resolution Fluorescence Microscopy”, Aust. J. Chem. 63, 1-5, (2010)
- L.M. Hirvonen, K. Wicker, O. Mandula and R. Heintzmann, “Structured illumination microscopy of a living cell”, European Biophysics Journal 38 (6), pp. 807-812 (DOI: 10.1007/s00249-009-0501-6)
- L. Hirvonen, O. Mandula, K. Wicker and R. Heintzmann”Structured illumination microscopy using photoswitchable fluorescent proteins”, Proc. SPIE, Vol. 6861, 68610L (2008); doi:10.1117/12.763021


